Prediction Markets Have a Semantic Tick Size
by @allquantor Prediction Markets talk too much. Most markets have price moves. Prediction markets have price moves that immediately turn into arguments. If a large-cap stock goes up 0.4%, the
by @allquantor
Prediction Markets talk too much.
Most markets have price moves. Prediction markets have price moves that immediately turn into arguments.
If a large-cap stock goes up 0.4%, the average observer says, “okay.” An algorithm bought some shares to hedge an options book, or a mutual fund rebalanced its portfolio. The reaction is mostly silence. A prediction contract, however, goes from 47 to 48 and suddenly everyone looking at the screen is a constitutional scholar, a campaign strategist, and a part-time Bayesian. One cent in a prediction market is economically tiny and emotionally enormous. A single penny changing hands is a price move, but it is also a tiny editorial about the state of the world.
That is why this analysis is so incredibly revealing.
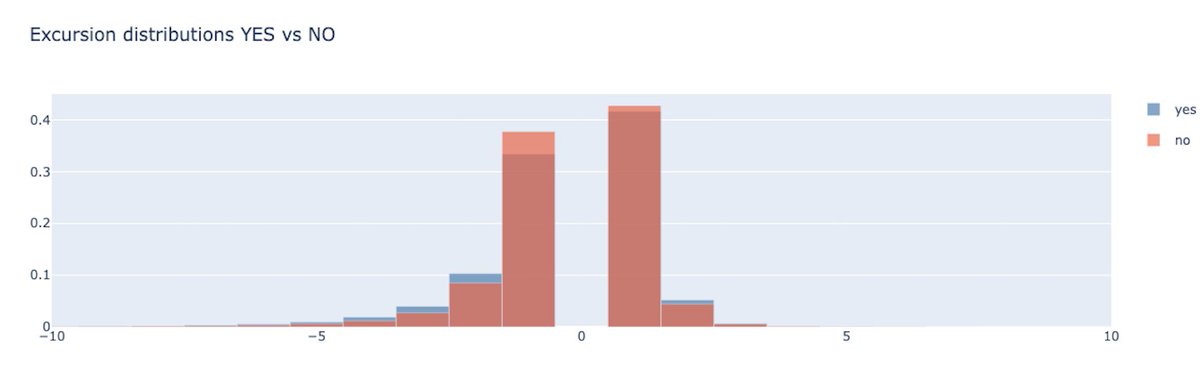
In our sample data of 600.82 million raw datapoints from Polymarket orderbooks, about 70% of 1-cent excursions do not go on to make another 1-cent move in the same direction. The market is not trending heroically toward the fundamental truth. The market is just clearing its throat. Most of these little micro-moves are not Act I of something important. They are the whole play.
Observing that mean reversion exists is, by itself, barely a thesis. Mean reversion exists in stocks, futures, foreign exchange, options, and in the emotional life of anyone who has ever panic-texted and then deleted the message five minutes later. The genuinely interesting question is what specific variety of mean reversion we are looking at in the order book.
In equities, small reversals are usually just plumbing. Temporary price pressure, inventory rebalancing, bid-ask bounce. Order imbalances move prices a little bit before other traders lean the other way and push them back. Prediction markets have all of this normal plumbing, but here, the plumbing comes with subtitles.
Prediction-market prices are interpreted as probability-like objects. Because the contract resolves at either $1 or $0, a 1-cent move is universally read as *“the market just revised the probability of this event by a full percentage point.” *In a traditional stock, microstructure noise is economically meaningful but narratively dull. In a prediction market, that exact same microstructure noise arrives wearing a nametag that says “Information.”
You have essentially discovered the “semantic tick size.”
A tick is a unit of price, but in this specific architecture, it is also a unit of story. In a traditional market, a tiny move is wallpaper. In a market asking “Will Candidate X win?”, a 1-cent move is an op-ed. Humans are notoriously bad at ignoring op-eds. That dynamic makes chasing momentum wildly tempting, and fading that momentum deeply profitable.
Prediction markets suffer from standard bid-ask bounce, plus the added friction of amateur political philosophy.
The strategy that capitalizes on this is almost rude in its simplicity. You observe a 1-cent excursion, you assume the last trader was a little overeager, and you take the other side before the next 1-cent threshold gets breached. You are not bringing a superior informational edge to the table. You are not outsmarting the wisdom of the crowd. You are simply operating a toll booth for impatience.

There is a great old prediction-market irony here. One of the best older papers on prediction-market microstructure is Paul Tetlock’s study of TradeSports. Its wonderfully impolite conclusion is that adding more liquidity does not necessarily make prediction-market prices more efficient. Sometimes, it actually makes them less efficient, because massive walls of passive limit orders sit in the book and artificially slow down the incorporation of new information. In his interpretation, some liquidity providers are effectively too naïve or too passive, and their orders become speed bumps for price discovery rather than pure aids to it.
That matters immensely, because your backtested strategy is essentially the other side of that exact observation.
Tetlock says some prediction-market liquidity can stand in the way of information. Your data says some prediction-market taking can stand in the way of calm. Put the two together and you get a lovely, deeply amusing picture of these markets as ecosystems where both sides are occasionally just a bit too eager in the wrong direction. Limit orders can be entirely too patient. Market orders can be entirely too impulsive. The result is a market that is highly directionally useful over time, and locally ridiculous in the short run.
That friction is not a flaw. That friction is a habitat.
Looking closely at the data and the execution overlays, a few genuinely new inferences jump out. These are not standard literature facts, these are idiosyncrasies of the modern prediction-market trader.
-
First, the market’s smallest unit of overreaction is narrative, not numerical. The one-cent move matters precisely because humans read it as “probability changed,” not because one cent is a financially large commitment. The overreaction is driven by the human desire to interpret the tape, not the math of the tape itself.
-
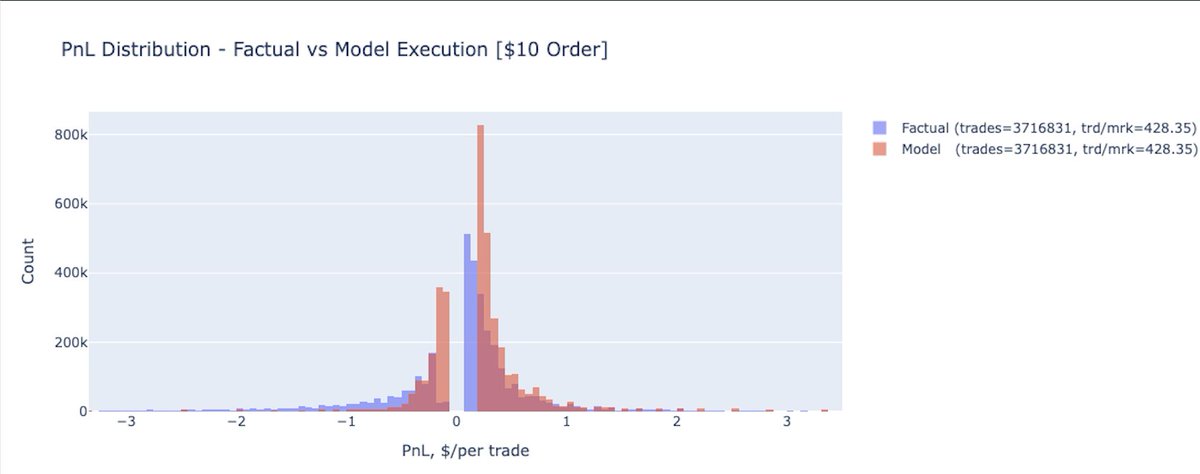
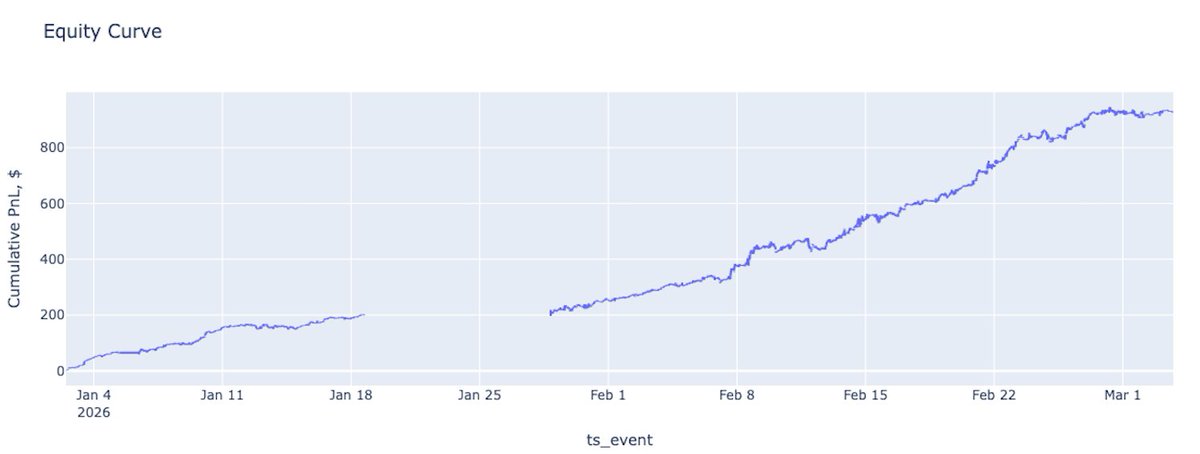
Second, the edge comes from repeated minor overstatement, not occasional panic. The smoothness of the equity curve and the positive center-of-mass in the PnL distributions are incredibly telling. This strategy looks like the business of harvesting routine impatience rather than trying to catch spectacular, cinematic collapses.
-
Third, the YES/NO symmetry is mechanically manufactured. If the excursion shapes were wildly different between the YES and NO sides, the obvious explanation would be political bias or narrative delusion where people blindly buying YES because they want a specific outcome. But the shapes are broadly similar. This strongly suggests the venue is producing reversible motion mechanically.
-
Fourth, the strategy measures how often prediction markets mistake a first-pass interpretation for a settled belief. In a stock, a small move is inventory. In a prediction market, a small move aggressively pretends to be knowledge. The 1-cent fade is basically charging rent to that pretense.
-
Fifth, the alpha is not entirely PowerPoint-native. The factual-vs-model execution overlay is quietly the best chart. The absolute worst thing about backtests is that they are beautiful, pristine mathematical constructs that work perfectly right up until the exact moment they are introduced to the concept of other people. Many strategies die on contact with actual market mechanics. Reality looks a bit worse than the fantasy, which is exactly how a grounded strategy should look.
Naturally, every mean-reversion strategy shares the exact same villain: the move that actually turns out to be real.
The entire mathematical logic of the fade relies on the fact that most 1-cent excursions are overdone. But “most” is not “all.” Financial markets have a recurring, deeply held hobby of turning a trader's statistical comfort zone into a painful opportunity for personal growth. The 30% of moves that do continue are where the catastrophic drawdowns and the lectures come from.
This is why the rigid implementation constraints small order sizes, one position per market matter so much. We wrote alot about execution risk in the past btw.
Prediction markets are brilliant information aggregators. But they are also highly efficient machines for manufacturing tiny, extremely legible, and deeply overinterpreted bursts of motion.
**Which is excellent, because otherwise nobody would write about them.
P.S there will be a vault **@ZEITFinance based on this research.